This guide demonstrates how to set up Jenkins integrations to Observe using Observe Agent and Jenkins’ OTEL Plugin
This guide is meant to be a replacement for Jenkins CI/CD integration - Observability Cloud documentation which is now deprecated. It serves as “Jenkins 2.0” without the need for an app and instead provides logs and metrics datasets out of the box.
As a result, the integrations helps you monitor the activity and health of your Jenkins pipeline with logs & metrics datasets that include information about your Jenkins jobs, builds, build logs, nodes, agents, and more.
 Instructions
Requirements:
-
Jenkins Instance
-
Amazon Linux 2+ EC2 (can also use Ubuntu)
-
An Observe Tenant
If you have fluentbit running, ensure you have that disabled on the machine before installing observe-agent due to port clashing
If you have the stats gatherer plugin in Jenkins, disable that as well
Observe-Agent Setup
- On your Observe tenant, navigate to “Add Data” and click “Linux” under “Observe Agent” (this may need to enabled as part of a feature flag for your tenant if it doesn’t show up)

-
Follow the instructions on the Observe-Agent installation page. Namely, you will need to:
-
Create an ingest token
-
Select the data to send to Observe (leave default to logs & metrics)
-
Install Observe-Agent on your EC2
-
Configure the Observe Agent
- Ensure that you have created a token before running this command!
-
Start the Observe-Agent and ensure that it’s running successfully
-
Verify you’re receiving data from Observe Agent
-


-
Running
observe-agent statusshould show something similar to the following with “Status: Running”If there are any issues configuring
observe-agentitself, follow the docs here: Troubleshooting - Observability Cloud documentation -
Edit the
observe-agent.yamlto include jenkins log.

- Run
sudo vi /etc/observe-agent/observe-agent.yaml
#Under host_monitoring, add jenkins:
host_monitoring:
    enabled: true
    logs:
        enabled: true
        include:
            - /var/log/**/*.log
            - /var/log/syslog
            - /var/lib/jenkins/**/*.log # system logs
            - /var/lib/jenkins/jobs/**/log   #  build logs
- Run
sudo systemctl restart observe-agent - Run
observe-agent statusto ensure Observe Agent is still running after the restart.
Jenkins Setup
-
Ensure you have a Jenkins instance running on your machine
-
Navigate to “Plugins” from the main home page
-
Install the OpenTelemetry Plugin and ensure it’s enabled
-
Once installed, navigate to “System” from the main home page to configure the plugin
-
Under OpenTelemetry, set the OTLP Endpoint to point to the endpoint provided by the Observe-agent
-
This will be http://localhost:4318
-
Set “No Authentication”
-


If installing on Kubernetes, the endpoint will be the following:
http://observe-agent-forwarder.observe.svc.cluster.local:4318Install Observe Agent on Kubernetes - Observability Cloud documentation
-
Under “Advanced”, ensure your configuration properties are set as below
-
Click “Save” and “Apply”
-
Navigate back to the home page and click “System Log”
-
Ensure there are no errors such as the following example in the logs


Jenkins Data in Observe
-
Once both Observe Agent and Jenkins are configured properly, data should appear in Observe
-
First ensure data is coming from observe-agent to Observe
-
Under Overview, check that health is “Healthy” for data
-
-
Navigate to OpenTelemetry Logs in Log Explorer to view Jenkins Logs
-
Extract
attributes['log.file.path'])and filter for anything withjenkinsto find Jenkins logs that are written to disk -
Namely:
-
/var/lib/jenkins/**/*.log # system logs
-
/var/lib/jenkins/jobs/**/log # build logs
-
-
-
Navigate to OpenTelemetry Metrics in Metrics Explorer to find your Jenkins metrics
-
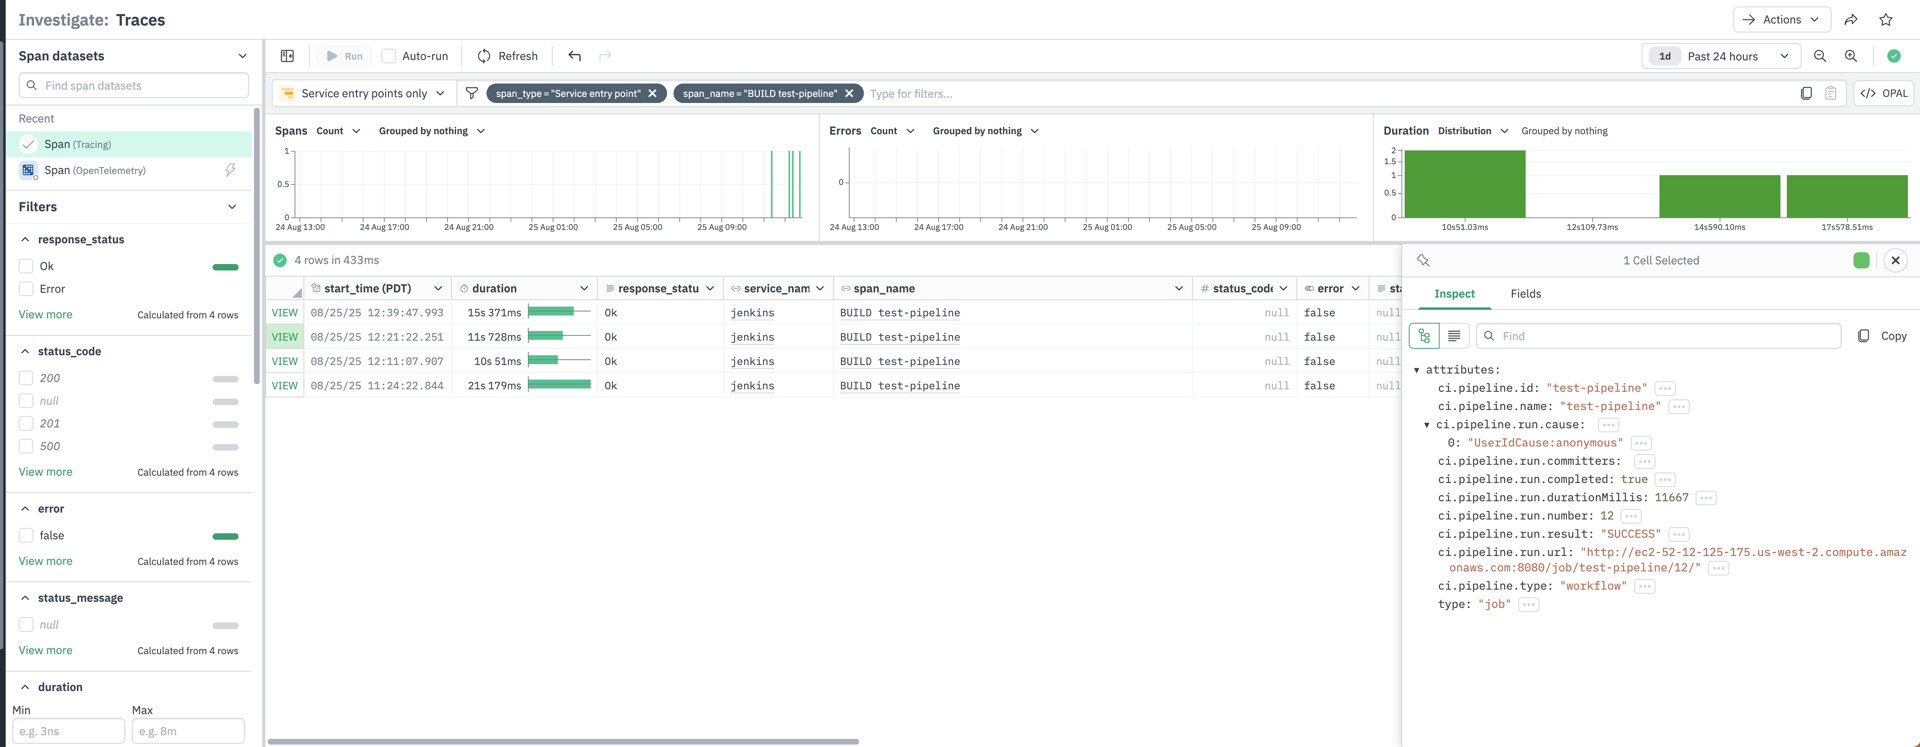
(Optional) If tracing is configured for your tenant, you may also receive trace data from Jenkins as part of the same plugin configuration. All other attributes are shown here