Dependent Parameters for Dashboards
If you are looking for a way to create dependent parameters for dropdowns, this might be the right topic for you. By combining a reference table with parameters, you can ensure that the parameters are tied together in a way to create dependent parameters.
Step-by-Step Guide
In this example, we will use sample data with City, State, Country, Latitude, and Longitude to create a functioning example.
-
Use the sample data to create a reference table. Name the reference table
city_state_country_lat_lonCity,State,Country,Latitude,Longitude New York City,New York,United States,40.7128,-74.0060 Buffalo,New York,United States,42.8864,-78.8784 Los Angeles,California,United States,34.0522,-118.2437 San Francisco,California,United States,37.7749,-122.4194 Miami,Florida,United States,25.7617,-80.1918 Toronto,Ontario,Canada,43.6532,-79.3832 Montreal,Quebec,Canada,45.5017,-73.5673 Vancouver,British Columbia,Canada,49.2827,-123.1207 London,England,United Kingdom,51.5074,-0.1278 Manchester,England,United Kingdom,53.4808,-2.2426 Edinburgh,Scotland,United Kingdom,55.9533,-3.1883 Paris,Île-de-France,France,48.8566,2.3522 Marseille,Provence-Alpes-Côte d’Azur,France,43.2965,5.3698 Berlin,Berlin,Germany,52.5200,13.4050 Munich,Bavaria,Germany,48.1351,11.5820 Sydney,New South Wales,Australia,-33.8688,151.2093 Melbourne,Victoria,Australia,-37.8136,144.9631 Rio de Janeiro,Rio de Janeiro,Brazil,-22.9068,-43.1729 São Paulo,São Paulo,Brazil,-23.5505,-46.6333 Tokyo,Tokyo,Japan,35.6895,139.6917 Osaka,Osaka,Japan,34.6937,135.5023 Beijing,Beijing,China,39.9042,116.4074 Shanghai,Shanghai,China,31.2304,121.4737 Delhi,National Capital Territory of Delhi,India,28.7041,77.1025 Mumbai,Maharashtra,India,19.0760,72.8777- Save the sample data to a file.
- Choose Data and Integrations → Add Data
- Choose CSV File where you have saved the sample data
- Use the name
city_state_country_lat_lonfor the Reference Table and chooseCityandStatefor the primary keys
-
Create a new Dashboard
-
Add a Card by Selecting Add Cards and choose Table → Dataset
-
Choose your reference table you just created, name the card
parameter_dataand then click Apply -
Next, we want to start creating the first parameter. Click Add Parameter → Single-value . Click Save and Select Cards. Select the
parameter_datacard and map to theCitycolumn. -
Next we will create a parameter for state. Choose Add Parameter → Single-value. Click the Save and Select Cards. Select the
parameter_datacard and map to theStatecolumn. -
Finally, we will add the parameter for country. Choose Add Parameter → Single-value. Click the Save and Select Cards. Select the
parameter_datacard and map to theCountrycolumn. -
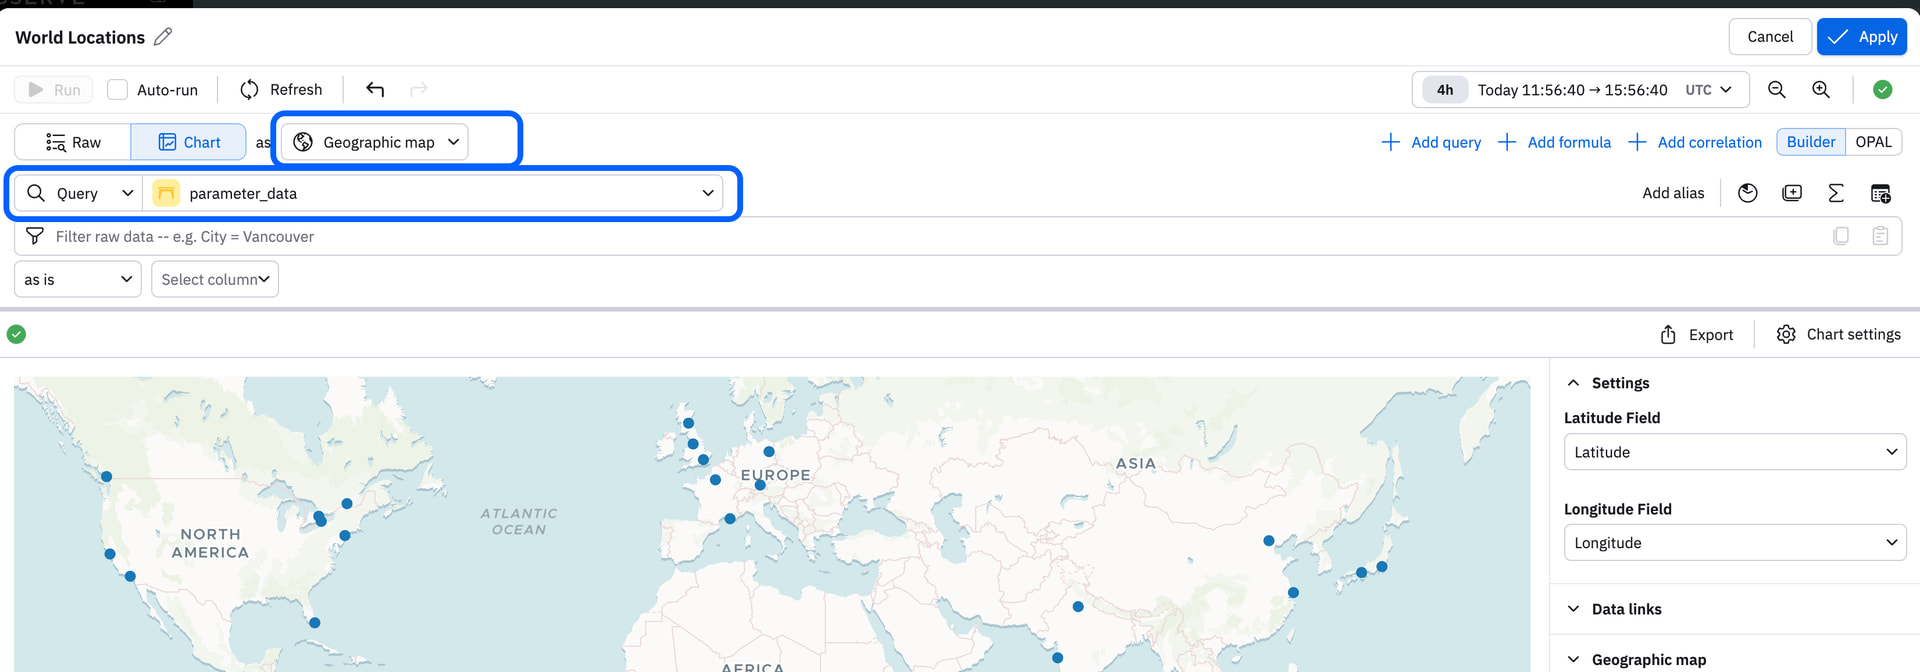
Now, to visualize your results. Choose Add to Dashboard → Visualizations → Dataset . Choose the source as a
Queryand choose theparameter_datacard. Select Geographic Map for the Chart type. You will need to select theLatitudeandLongitudeColumns in the Chart Settings. -
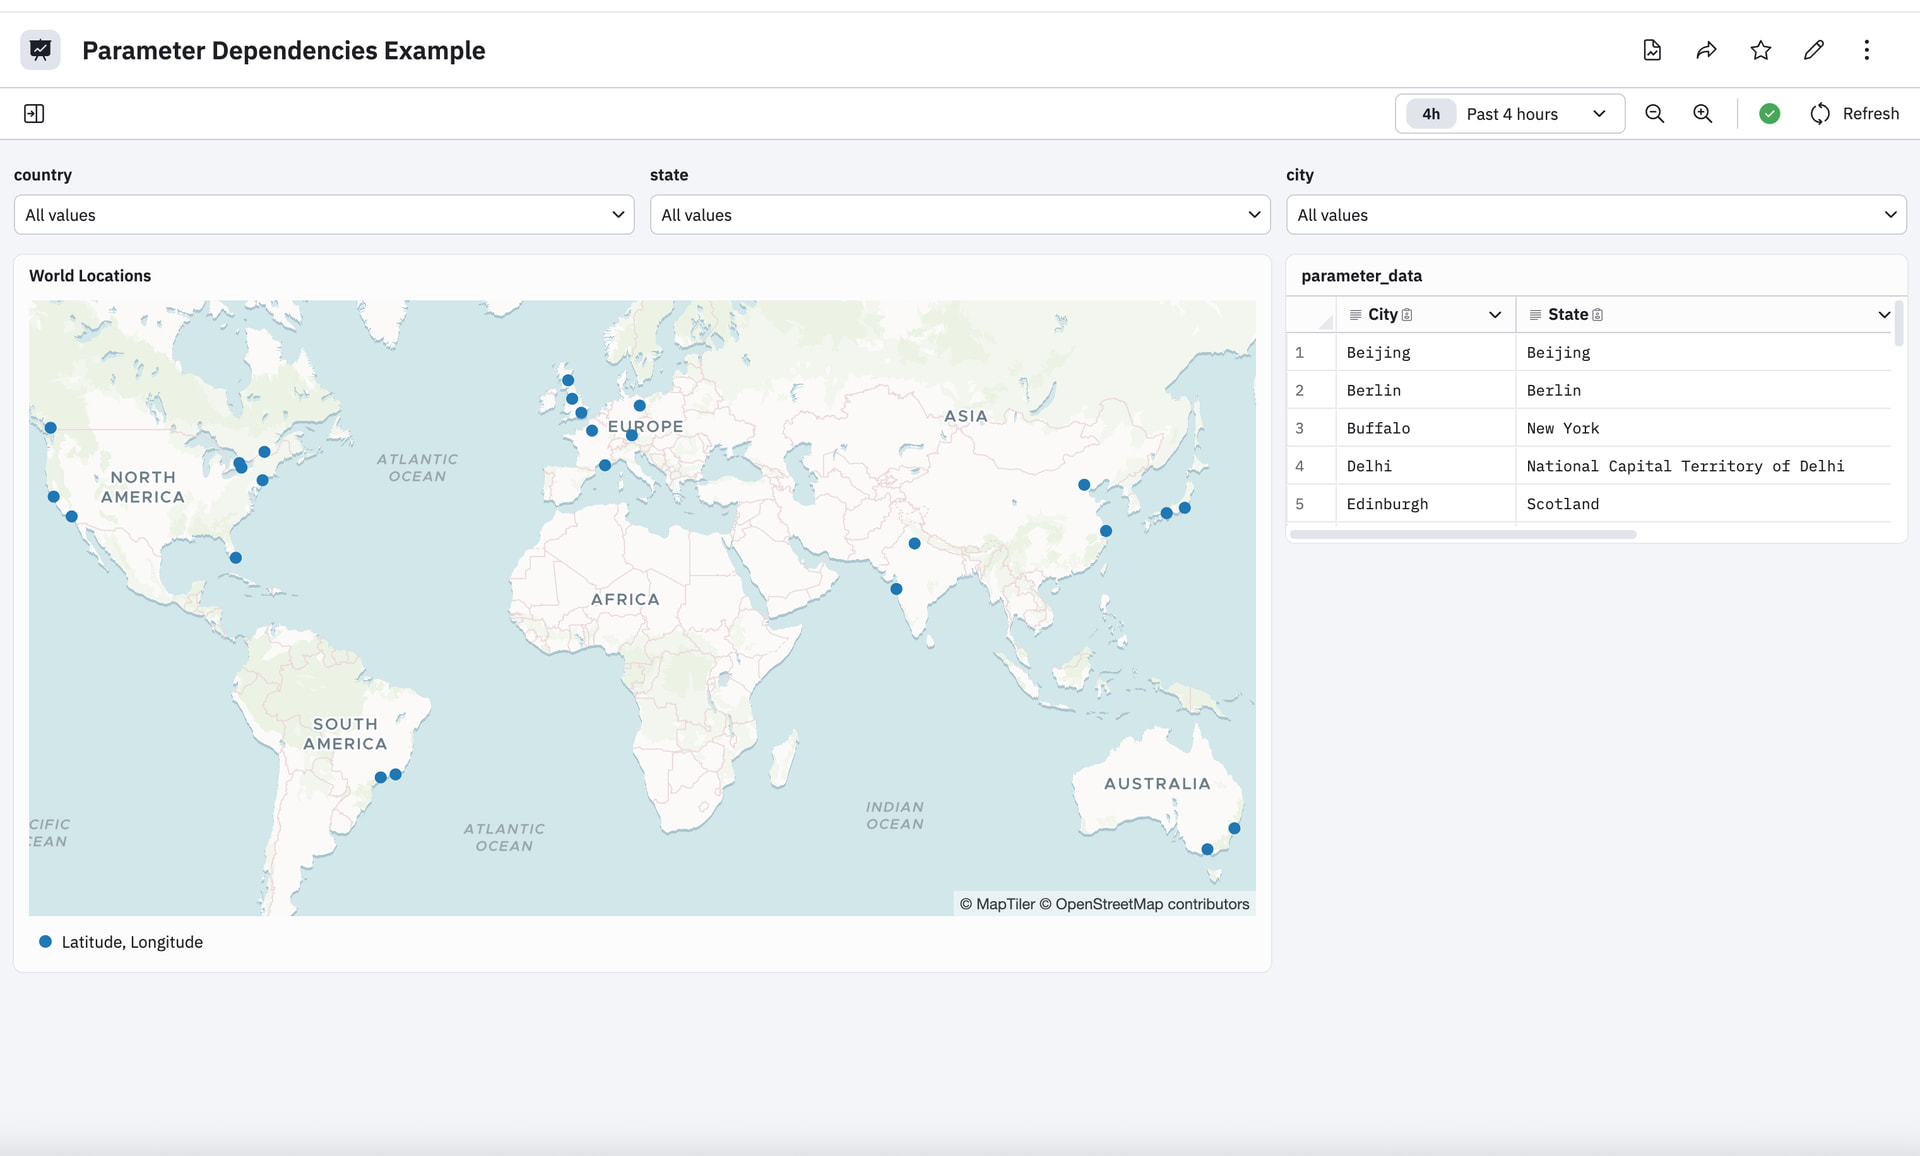
Once you have clicked Apply, you will notice that as you change the parameters, the
parameter_datatable’s possible values change. The map should also update according to your selections. -
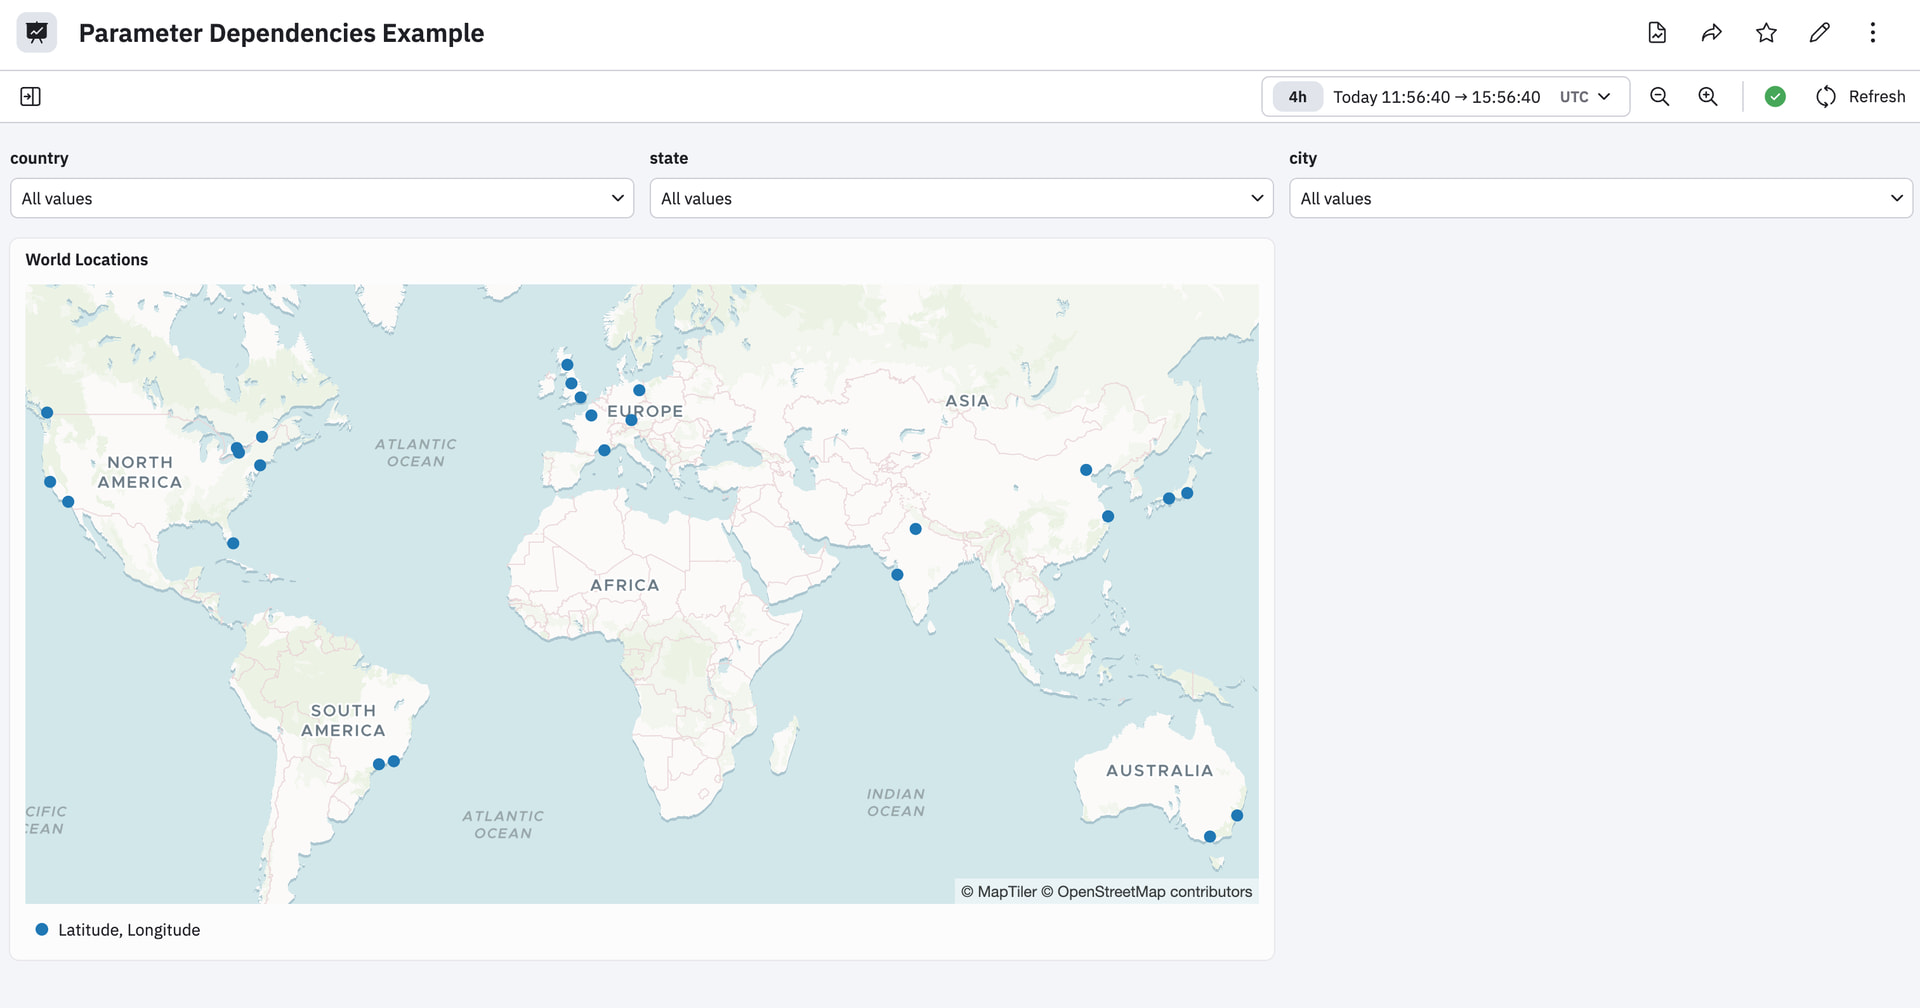
Although it is nice, for this example, to see the Tabular data, just know that you can also hide the card so that only the parameters and the map are showing. You can hide the
parameter_databy clicking Manage All Queries and then click on the 3 dots (…) next to theparameter_datacard. Choose Hide from dashboard. See the two examples below.


Hopefully this topic gives you an idea of how you can create dependencies between parameters that can drive your dashboard!