Overview
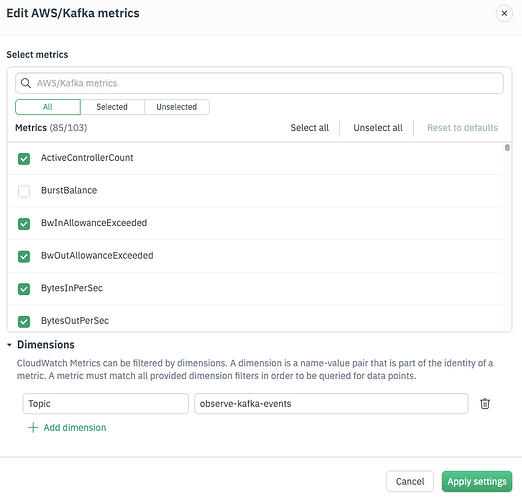
When setting up AWS metric collection in Observe via the Add Data UI, you can configure specific CloudWatch metric names and dimension filters (e.g., InstanceId, LoadBalancer) to narrow the scope of the data collected.
For example:
This article explains how those filters are handled when the integration is deployed using CloudFormation and why you won’t see dimension filters directly in the generated template.
How Metric and Dimension Configuration Works
1. Add Data UI
When you configure AWS metric collection via the Add Data UI, you:
-
Select metric namespaces (e.g.
AWS/EC2) -
Choose specific metrics (e.g.
CPUUtilization) -
Optionally apply dimension filters (e.g. only
InstanceId = i-abc123)
These selections are stored server-side in Observe.
2. Generated CloudFormation Template
After configuring your integration, the Add Data UI generates a CloudFormation template. That template includes:
-
DatasourceID— the identifier for your metric configuration stored in Observe -
ObserveAccountID,ObserveDomainName, andGQLToken -
IAM Role resources — enabling Observe to assume a role and pull metrics
You won’t see the actual metric or dimension filters embedded in the CloudFormation YAML.
3. Where Filtering Happens
Filtering on metric names and dimensions happens inside the Observe platform, not inside CloudFormation:
-
The
CloudFormationstack deploys a cross-account IAM role withcloudwatch:GetMetricData,cloudwatch:ListMetrics, andtag:GetResourcespermissions. -
When Observe assumes that role, it queries the metric configuration and uses the dimension filters defined in the UI at the time of setup.
